


Knowledge AI series 4/7 · Why Production Data Measured on the Floor Gets Lost
KEY POINTS
Most of the numbers on a sewing floor are still produced by sampling. An IE engineer times a few cycles with a stopwatch to set the standard time, and the office collects the quantities that line supervisors wrote on paper a day later. Numbers made this way vary with who measures and when, and as they are added up into weekly and monthly reports, the operation and style details drop out, so they cannot be used again for the next order. Only values measured for every cycle on the same basis can support improvement work from line balancing to reassigning operators, and go into the quotation and line plan for the next new order.
It’s WJ-2411’s first week on the line at the Vietnamese factory. The IE engineer stands at each operation with a stopwatch and times five cycles. Every hour, the line supervisor asks for the count at the end of the line and writes it on paper, and the next morning the office collects the sheets and copies them into Excel. A weekly result comes out at the end of each week and a monthly report at the end of the month.
A few weeks later, when WJ-2411 ships, these numbers are left as a single page in the monthly report. When a similar jacket comes in next season, the IE engineer picks up the stopwatch again. The numbers from last time exist somewhere, but no one can find and use them. We start with how the numbers are made, to see why production data measured on the floor does not get used for the next order.

Two ways numbers are made on the floor
There are two broad ways of producing the numbers on a sewing line.
The first is sampling. Instead of measuring everything, you measure part of it and let that stand for the whole. Timing a few cycles with a stopwatch, asking for counts every hour and writing them down, judging by eye, taking verbal reports and filling in from memory all fall into this group.
The second is continuous measurement. It records the start and end of every cycle at every operation. Values keep being recorded for as long as the line runs, with no one there to take the measurement.
In medical terms, sampling is a blood pressure reading taken once in the doctor’s office, and continuous measurement is a monitor you wear all day. The office reading is useful, but to know when and why your blood pressure went up, you need a record of the whole day.
How a stopwatch produces a standard time
The typical sampling method is stopwatch time study. The ILO defines time study as a work measurement technique for recording the times of a specified job, or the elements of it, carried out under specified conditions, and for analyzing the data.1 The procedure has eight steps. You record information about the job, break it into elements, examine the method and decide how many cycles to time, time it with a stopwatch, assess the worker’s pace (rating), convert the times to basic time, and add allowances to set the standard time.1
Two concepts matter here. Rating is the assessment of the worker’s pace against the observer’s own idea of standard pace. An allowance is time added to the basic time so the worker can recover physically and mentally. Standard time is the total time in which a job should be completed at standard performance.1
Basic time = average observed time × rating
Standard time = basic time × (1 + allowance)
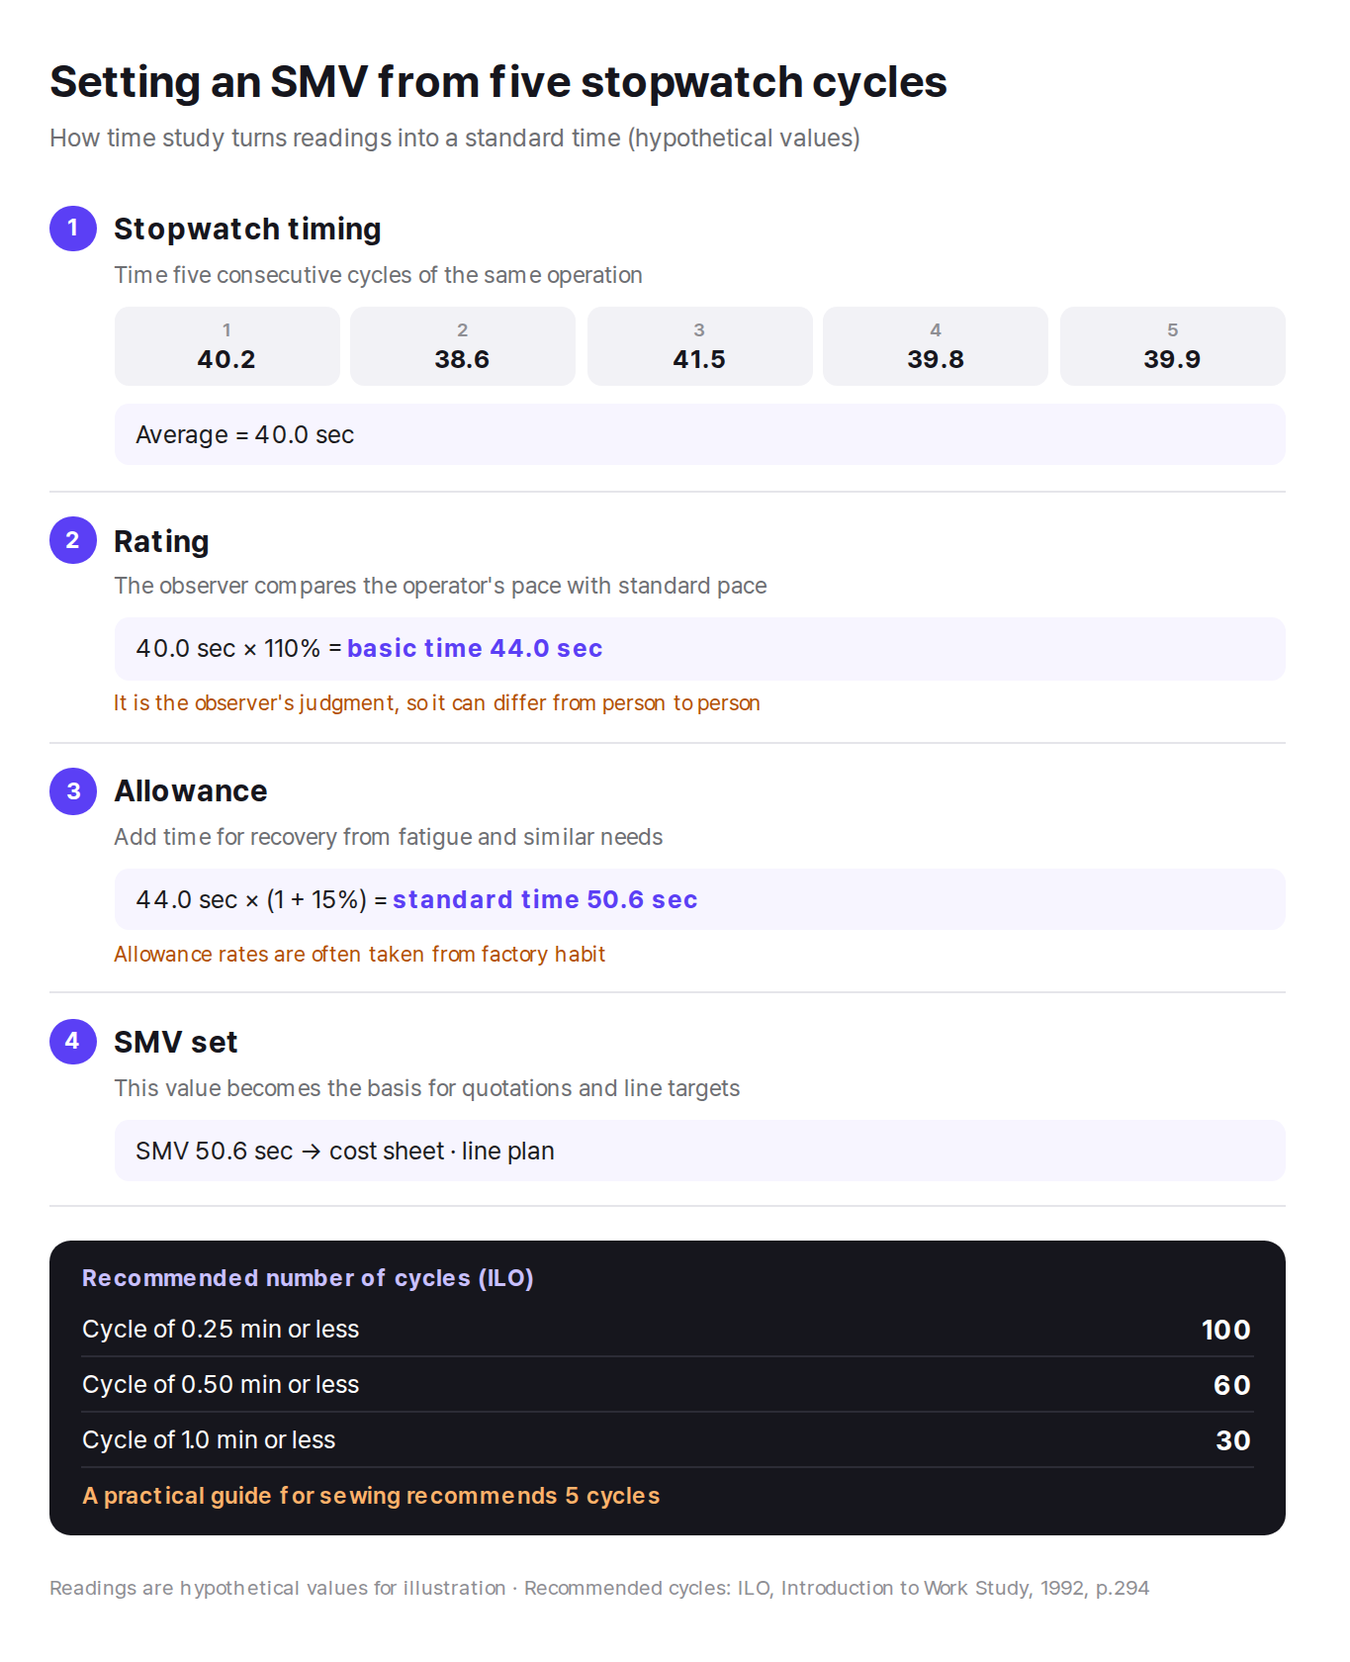
For example (these are hypothetical values), if the average of five cycles is 40.0 seconds and the observer rates the operator’s pace at 110%, the basic time is 44.0 seconds. Adding a 15% allowance gives a standard time of 50.6 seconds. This 50.6 seconds becomes the SMV, and the SMV becomes the basis for cost and line targets on the next order.
How many observations: the standard and the practice
There is also a set method for working out how many times to measure. The ILO manual has you take a few preliminary readings first, and then gives a formula for the number of observations needed at a 95.45% confidence level with a ±5% margin of error. In the manual’s example, five preliminary readings led to nine readings being needed.1 There is also a table of recommended counts by cycle length: 100 cycles if one cycle takes 0.25 minutes or less, 60 cycles for 0.50 minutes or less, and 30 cycles for 1.0 minute or less.1
Sewing operations have short cycles. In the example order from the process analysis series, the SMV per operation was around a minute: 12 seconds, 38 seconds, 60 seconds, 83 seconds. By the table, each of these operations should be timed 30 to 100 times. Yet a practical guide to time study for sewing operations recommends timing five consecutive cycles.2 A single line has dozens of operations, so timing each one dozens of times is not practical.
Why sampled values change with who measures and when
The number of readings is not the only thing that makes values vary. Who does the measuring, and when, also changes the result.
Rating is the observer’s judgment. The ILO notes that observers in their first weeks of training are unlikely to rate more finely than in steps of 10%.1 If two people time the same operator and their ratings differ by just one step, 100 against 110, the basic time differs by 10%.
Operators are aware of being observed as well. The ILO notes that nervous workers tend to work unnaturally fast during observation, which leads to mistakes.1 On the other hand, on sewing floors it is often pointed out that operators deliberately slow down during time study, worried that working fast will raise their targets.3 The ILO’s formula for the number of observations also comes with a caveat: it only holds when the variation in readings is due to chance and not caused deliberately by the worker.1
The allowance can also lack a clear basis. The author of the practical guide mentioned above wrote candidly that he used the allowance percentages his seniors used, without knowing where they came from.2 Standard times made this way become the cost for the next order.
Why manual counts end up only in reports
Collecting output counts is even harder. A common method for hourly output is for a helper or a work study person to go to the end of each line and ask for the count,4 and in some factories operators write their bundle quantities on a sheet of paper stuck to the sewing table.4 A recent study of Vietnamese garment factories also notes that output counts are often written on paper and only collected at the end of the shift, and that line monitoring is usually done by hand at the end of the day, which leads to errors and leaves no real-time visibility.5
The counts collected this way are rolled up from the daily report to a weekly summary and then into the monthly report. At each level, the numbers turn into totals and lose the information about which operation they came from. The daily report shows how many pieces each line made at what time, but the monthly report keeps only totals and efficiency by line. It no longer shows how many seconds an operation took on which style, or when and where a bottleneck occurred.
So even if you want to use it for the next order, you can’t. Quoting next season’s jacket requires times by operation, but what is left is a single line for line efficiency. The numbers were measured, but they were not kept in a form that can be used for the next decision. This is what the title of this post means by production data getting lost.
Seven kinds of improvement work that use continuous measurement
When every cycle is recorded by operation, the values can go straight into line improvement work, not only into reports.
| Improvement work | What it involves | Data needed |
|---|---|---|
| Line balancing | Redistributing each operator’s work to fit Takt Time6 | Actual cycle time by operation |
| Removing bottlenecks | Finding and fixing operations whose capacity is equal to or less than demand7 | Time by operation and WIP flow |
| Updating standardized work | Revising work procedures based on Takt Time, work sequence and standard WIP8 | Cycle time before and after improvement |
| Shorter style changeovers | Cutting the time from the last piece of the old style to the first good piece of the new style9 | Start and end of the changeover |
| WIP and pull control | Letting the downstream operation signal its needs to control upstream production10 | WIP piled up between operations |
| Root cause of defects | Removing the cause so the same defect does not come back11 | Operation and time where the defect occurred |
| Reassigning operators | Redistributing work elements between operators6 | Actual work time by operator |
All seven kinds of improvement work need data by operation and by time of day
None of the seven can be done with the numbers in a monthly report. The steps for balancing a line and breaking bottlenecks are covered in detail in What Man Power 0.5 Means: Three Ways to Break a Bottleneck.
Values can be compared only when measured the same way
Another advantage of continuous measurement is that every line and operation is measured the same way. That makes it possible to compare yesterday with today, this line with that line, and this order with the last one on the same basis. Values have to be comparable before they can be used as standard times, and only then can those standard times be used to calculate cost. SIJE calls a standard time measured on the line in this way AMV (Actual Measurement Value), to separate it from SMV, the planned standard time used for quotations.
Measurement is often mistaken for monitoring operators, but its purpose is to prove the factory’s production capability with numbers, not to watch people. Values built up on the same basis become the cost basis for the next order, and when the factory and the vendor disagree over efficiency assumptions in a quotation negotiation, they are the most reliable evidence the factory can present.
Measured data that is used only after a problem has happened comes too late, like shutting the barn door after the horse has bolted. It should be used to prevent the problem in the first place, and for that, the data collected has to go into the quotation and line plan for the next new order. The ILO also finds that when information such as standard times is ready before production starts, management can act before delays occur.1
The same goes for the IE engineer at the start of this post. When next season’s jacket comes in, the engineer should be able to pull up the operation times already measured on WJ-2411 before picking up the stopwatch again.
How SIJE handles this
Monolog is attached to each operator’s table on the sewing line and measures output, cycle time, and the line’s running and idle periods by operation. Existing equipment stays as it is. The device version detects cycles from sewing vibration, and the tablet version detects them from the operator’s hand movements. For hand movements, it extracts only joint coordinates from the video to make its judgment, and the original video is discarded within 0.5 seconds. The measured standard times (AMV) built up this way go into Monolis as its cost basis and become the basis for quoting the next order. How incorrect sensor signals are filtered out is explained in Sewing Factory IoT War (3): Sensor Outlier Detection and Output Confirmation.
The next post, Why CM Is the Only Shared Variable in FOB Cost, covers the cost sheet that these measured times feed into. We look at why CM is the only line on the cost sheet that the vendor and the factory both look at.
Knowledge AI series
1. How Apparel Orders Are Split Between Knowledge Services and Manufacturing
2. Where Information Changes Hands in the Supply Chain Workflow
3. Why the Same Order Number Is Entered Again and Again Until Shipment
4. Why Production Data Measured on the Floor Gets Lost (this post)
5. Why CM Is the Only Shared Variable in FOB Cost
6. Why Vendor and Factory Calculate the Same CM in Opposite Directions
7. How Measured Values Become a Company Asset
References
- George Kanawaty (ed.), Introduction to Work Study, 4th revised ed., ILO, 1992. Definition of time study (p.265) and its eight steps (p.286), definitions of rating (p.302), allowances (p.331) and standard time (p.336), formula and example for the number of observations (p.292~293), table of recommended cycles (p.294), rating limits for new observers (p.311), changes in worker pace during observation (p.285), benefits of standard data before production (p.436). ↩
- Prasanta Sarkar, How to do Time Study for Garment Operations?, Online Clothing Study, 2011. Recommendation to time five consecutive cycles, and practice in applying allowances. ↩
- Prabir Jana & Manoj Tiwari, IE in Apparel Manufacturing 3: Work Measurement using Time Study, Apparel Resources, 2014. Operators slowing down during time study. ↩
- Prasanta Sarkar, Hourly Production Report: the Basic Tool to Control Daily Production, Online Clothing Study. How hourly output counts are collected. ↩
- Vo, Nguyen, Dang, iScience, 2026. Paper records collected at the end of the shift, and the limits of manual line monitoring. ↩
- Lean Enterprise Institute, Lexicon, Operator Balance Chart. Distributing work to Takt Time and redistributing work elements. ↩
- TOC Institute, The Goal Summary. Definition of a bottleneck in the Theory of Constraints (citing Goldratt, The Goal). ↩
- Lean Enterprise Institute, Lexicon, Standardized Work. The three elements of standardized work. ↩
- Lean Enterprise Institute, Lexicon, Changeover. How changeover time is measured. ↩
- Lean Enterprise Institute, Lexicon, Pull Production. Definition of pull production. ↩
- Lean Enterprise Institute, Lexicon, 5 Whys. Preventing recurrence by removing the root cause. ↩
