


AI Process Analysis series 3/6 · (3) What Man Power 0.5 means
Key takeaways
Man Power is not a column for counting heads. It is the dial that tunes each operation to Takt, and assigning 0.5 makes that operation’s bar twice as long, not shorter. There are three ways to break a bottleneck: add operators, pair up short operations, or change the operation itself. Look at the operation first and headcount and CM both stay where they are.
I handed an operation breakdown to a junior who was seeing one for the first time. He studied it for a while and asked: “Where is the half a person?”
There is no half a person on a line. And yet the table has 0.5 in it, and 2.0 on some rows. The last post covered what those numbers stand for. This one is about how they actually get decided. Every screen and figure here is example data, from order DR-2026-001.
Change Man Power and the bar moves
The bar in the balancing chart is Bar = SMV ÷ M/P, exactly as the screen states. SMV is the time the operation needs and Man Power is the operators on it, so the bar shows how much of one person’s time the operation takes.

There is one place where this trips people up. Assigning 0.5, which sounds like less manpower, makes the bar longer rather than shorter. The example screen has an operation at SMV 24 sec. Give it Man Power 0.5 and the bar becomes 48. That operator is also covering another operation, so only half their time lands here, and the interval between pieces coming out of this operation doubles.
The other direction works the same way. An operation at SMV 72 sec with Man Power 1.5 gives a bar of 48. More people on it, shorter interval per piece.
So Man Power is not a column for counting heads. It is the dial that tunes each operation’s speed to Takt.
What changes on screen when balancing runs
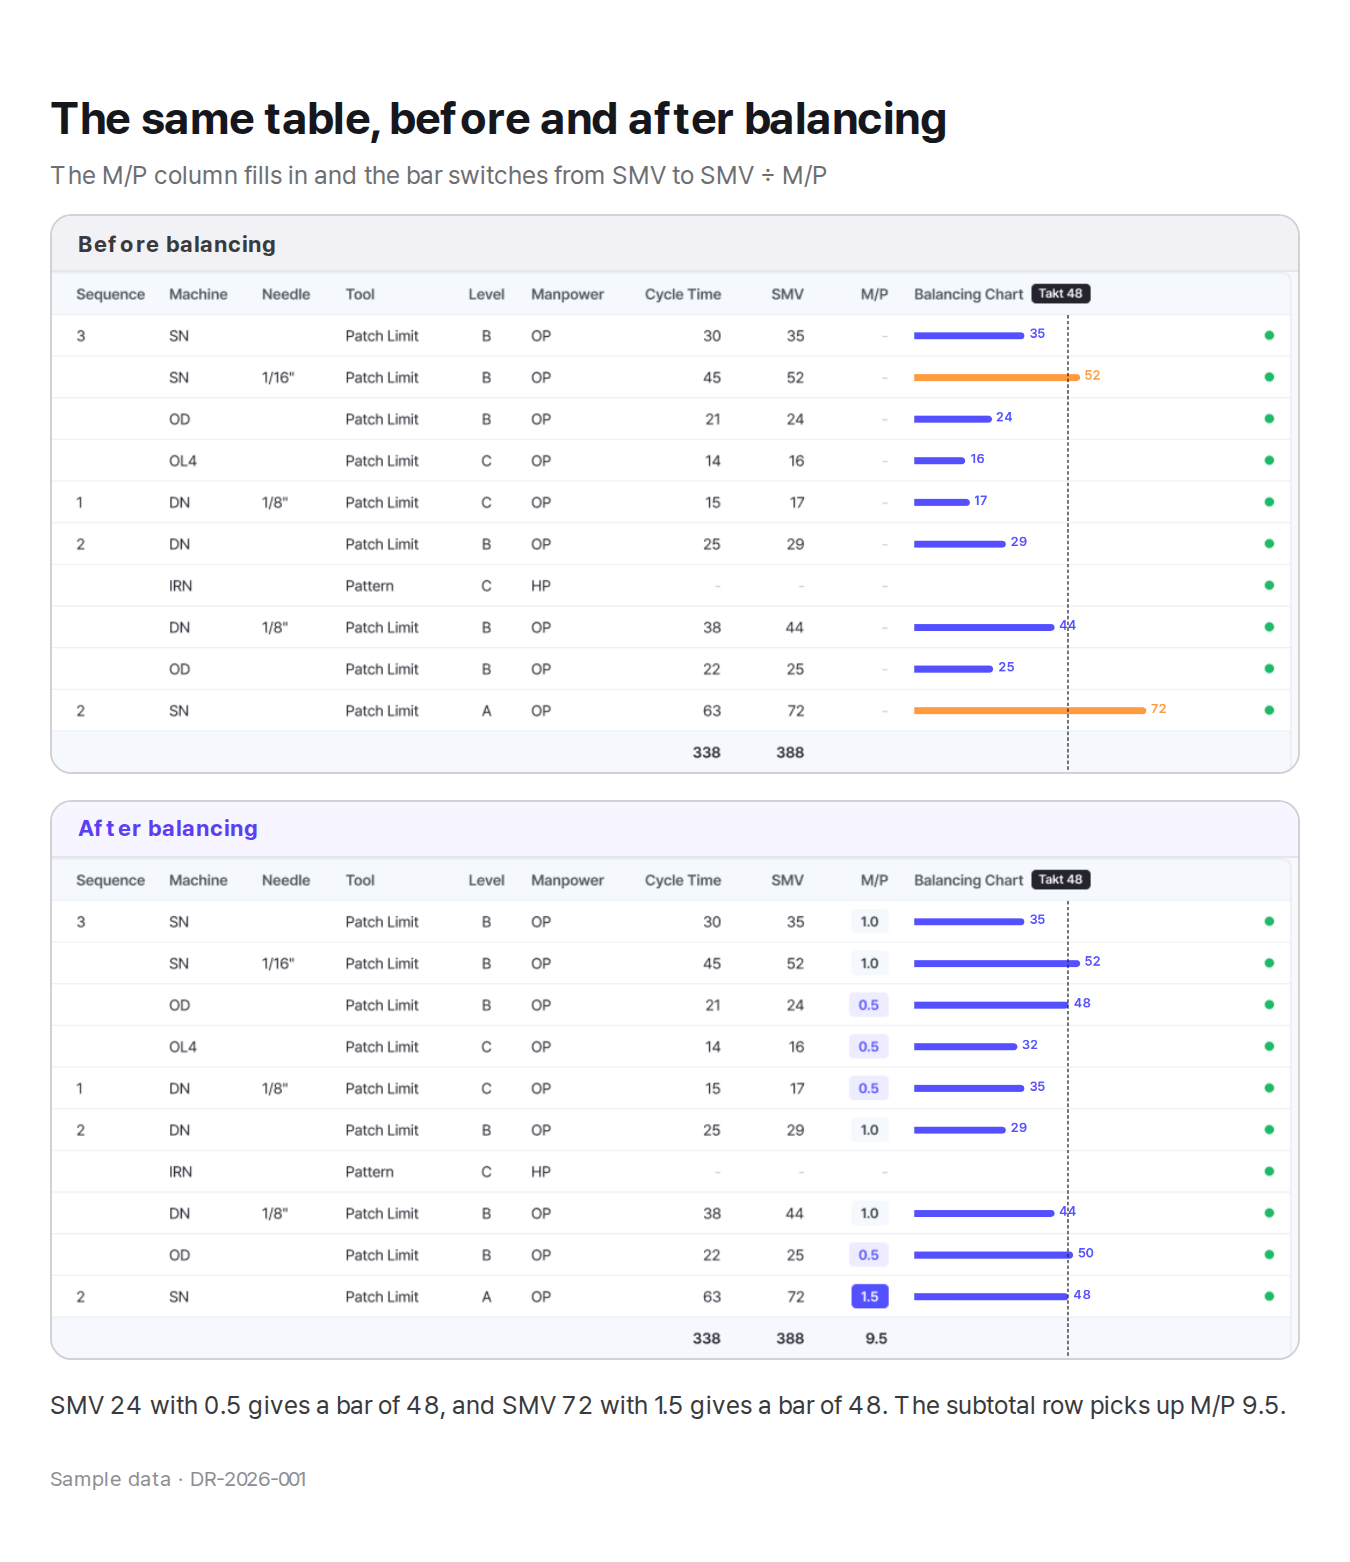
The top half is before balancing. The M/P column is empty and the bars are the raw SMV values. There are only two entries in the legend: orange for SMV over Takt, operations one person cannot hold, and blue for SMV under Takt. At this stage the table has decided nothing. It shows where the work spills over and where it falls short.
The bottom half is after. The M/P column carries 1.0, 0.5 and 1.5, and the bars are redrawn as SMV ÷ M/P. Both rows from a moment ago are here: SMV 24 with 0.5 for a bar of 48, SMV 72 with 1.5 for a bar of 48. The subtotal row picks up M/P 9.5.
Same table. Before balancing it is a list of operations; after balancing it is a layout for the line.
How AI split 42 operations
After balancing, the summary on the example screen reads Operators (M/P) 37.0 ppl and Line Balance 76 %. The breakdown is written out alongside it.

Three long operations at 2.0, three more at 1.5, seventeen at 1.0, and nineteen short ones at 0.5. The comment on screen says the same thing in a sentence.
“37.0 operators on 42 operations: 3 long operations get 2 operators, 19 short ones are shared at 0.5.”
Close to half the operations sit at 0.5. This line has that many short operations, which also means its balance comes more from pairing the short ones than from splitting the long ones.
And even after all that, one row is still standing.
Three ways to break a bottleneck
Operation 20, top stitch front neck binding, runs 53 seconds. The line is 48. That one row sets the speed of the whole line. However fast the rest are, the pieces coming off the end are paced by this operation.
On the floor you know without looking at the table. That is the only station with work piling up in front of it. The operator is chasing it and the next station is standing idle.
There are only three ways out.

Add another operator. The fastest route. The bar drops on the spot. It does not work everywhere, though. Some operations have only one workstation, or cannot have two people on the same piece at once. Top stitching is one of those, where the stitch runs even only if one person carries it through. And every person you add pushes CM up.
Pair up the short operations. This collects the slack instead of adding people. The cost does not show on the table: it is changeover time. If the two operations use different machines the operator has to move, and if the parts are far apart the work in progress travels across the line. So when you pair operations, read the Sequence column and the Machine column together. Same machine, adjacent in sequence, as a rule.
Change the operation itself. The first two move people. This one changes the work. The Machine column carries SN, OD, OL4, DN and MAN; the Tool column carries Patch Limit, Pattern and Scissor. Fit the right tooling to the operation and the time comes down without anyone being added. It is the only route that drops the bar while leaving both headcount and CM where they are.
The third is what an IE does, and it is also where AI does not stand in for you. Which attachment fits that operation, and whether this factory owns that machine, is known only by someone who knows the floor. AI names the bottleneck. The move after that is yours.
The order to do it in
Mix the three in any order and the line wobbles. This is the order I use.

Confirm the bottleneck first: how many operations cross the line and which one is longest. Then look at whether the operation itself can be improved. If tooling or a machine solves it, headcount and CM both stay put. If it still runs over, add people. Last, collect the slack and pair up the short operations.
Reverse that and start by adding people, and the line balances but the quote goes out with a higher CM. That it could have been solved by changing the operation only surfaces once production has started.
How to read Line Balance 76%
The screen shows Line Balance 76 % with the basis written underneath: Σ process time ÷ (max × 42). The max in the denominator is the longest operation, so the structure hits 100% only when every operation is as long as the longest one.
Which means 100% does not exist in practice. Operations differ in length; that is normal. Where the acceptable line sits depends on the factory and the item.
One thing is clear, though. This number matters less as an absolute than as a change. If it went up from yesterday to today on the same style, the record has to show who changed what in between. Without that record, the same improvement has to be rediscovered from scratch on the next style.
A line does not run on headcount
The 0.5 looked strange to me too, the first time. Years later it strikes me as the most honest notation for a sewing line there is. A line does not run on how many people are on it. It runs on where their time goes, and how much of it.
| Route | Effect | What it costs | When it does not work |
|---|---|---|---|
| Add another operator | The bar drops immediately | Headcount rises and CM goes up | Operations two people cannot work at once |
| Pair up short operations | No extra headcount | Changeover time, WIP movement | Different machines, or far apart in sequence |
| Change the operation | Headcount and CM stay put | Review time, tooling preparation | When the factory lacks the equipment |
Previous: How to Read an Operation Breakdown: Operations, SMV, Takt, Man Power
Next: Why the First Week Loses Money: Putting the Learning Curve into the Quote
The next post covers why the first week never hits target however well it is run, and how to put that into the quote.
