


From 4.7% on the Quote to 3.4% at Settlement: Pre-Costing in Practice
KEY POINTS
Pre-costing is the cost you work out before you answer a buyer with a price. It is built line by line from three blocks (materials, CMP and other costs), and it gets cut during negotiation. Even after the price is fixed, extra fabric orders, freight, testing and claims keep eating into the profit. This article follows the example cost of one dress style, 3,000 pieces, from quote to settlement, and shows how a 4.7% profit on the confirmed cost sheet became 3.4% at settlement.
“How much can you do this style for?” When that email comes in from a buyer, the vendor’s costing person does the math before writing back. How many yards of fabric, at what price per yard. What the factory charges for cut, make and pack. How much freight and testing will add. Put together, that gives the cost of one garment. This cost, worked out before the price is set, is the pre-cost.
When the order is finished, the cost is calculated again. This time it uses the fabric quantity actually ordered, the freight actually paid and the claims actually received. That is the post-cost. Put the two side by side and every line shows what went differently from the plan.
Here we follow a mesh pleated dress, 3,000 pieces, from start to finish. All numbers are example values from the Monolis demo screens.1 We covered what goes into FOB in Why CM Is the Only Shared Variable in FOB Cost and how CM is built in Process Analysis Is Cost Design, so this article stays on how the cost is set, cut and leaked.
A Cost Sheet Has Three Blocks
The cost sheet a vendor sends to the buyer is called the CBD (cost breakdown). It runs to dozens of lines, but it comes down to three blocks.
The first is materials (A). Fabric, sewing trims (zipper, thread, labels), packing trims (polybags, cartons), and outsourced processes such as printing and washing that go to outside process houses all sit here. The second is CMP (B): what the factory charges to cut, make and pack. The third is other costs (C): freight, testing, handling, commission and finance. These never go into the garment, but the order cannot ship without them.
Add the three blocks and you get the net cost. Add profit to that and you get the FOB price the buyer pays.

On the confirmed cost sheet, materials $9.29, CMP $2.95 and other costs $0.45 add up to a net cost of $12.69. FOB is $13.31 and profit is $0.62 a piece. For 3,000 pieces that is a net cost of $38,070.00, an order amount of $39,930.00 and a profit of $1,860.00, or 4.7% of the order amount.
The shares tell you where to focus. Materials take 69.8% of FOB. CMP takes 22.2% and other costs 3.4%. Whether a pre-cost is right or wrong is decided mostly in the materials block.
Materials Are Built One Line at a Time
Material cost is never a single guess. You list every material that goes into one garment, one line each, and on every line you multiply “how much one garment uses” by “how much one unit costs.” The amount one garment uses is called consumption, or YY. For fabric it is the length in yards needed to cut one garment. For labels it is the number sewn on one garment.
Cost per piece = consumption × unit price
The formula is the same everywhere, but the unit changes by item. Fabric is counted in yards, zippers and labels in pieces, hooks and eyes in sets, thread in cones and cartons in cartons. A few typical lines work out like this.
| Group | Item | Unit | Consumption | Unit price (USD) | Cost per piece (USD) | Qty for 3,000 pcs | Amount (USD) |
|---|---|---|---|---|---|---|---|
| Fabric | Mesh (shell) | yds | 1.4500 | 3.600 | 5.22 | 4,350.0 | 15,660.00 |
| Fabric | Jersey rib (neck binding) | yds | 0.2200 | 3.600 | 0.79 | 660.0 | 2,376.00 |
| Sewing trim | Thread | cone | 0.1000 | 1.400 | 0.14 | 300.0 | 420.00 |
| Sewing trim | Hook & eye | set | 2.0000 | 0.060 | 0.12 | 6,000.0 | 360.00 |
| Packing trim | Carton | ctn | 0.0333 | 3.000 | 0.10 | 100.0 | 300.00 |
| Outsourced process | Washing | pc | 1.0000 | 0.220 | 0.22 | 3,000.0 | 660.00 |
Some of these numbers look odd at first. Thread at 0.1000 cones means one cone sews ten garments. Hook and eye at 2.0000 sets means two sets go on the back neck. Carton at 0.0333 means 30 garments go into one carton, so each garment uses a thirtieth of a carton. That is why 3,000 pieces need 100 cartons. Washing and other outsourced processes happen once per garment, so their consumption is 1.0000.
This dress has 5 fabric lines, 8 sewing trim lines, 6 packing trim lines and 4 outsourced process lines. Add them up by group and you reach the $9.29 material total.
| Group | Lines | Cost per piece (USD) | Amount for 3,000 pcs (USD) | Share of FOB |
|---|---|---|---|---|
| Fabric | 5 | 6.84 | 20,520.00 | 51.4% |
| Sewing trims | 8 | 1.12 | 3,360.00 | 8.4% |
| Packing trims | 6 | 0.38 | 1,140.00 | 2.9% |
| Outsourced processes | 4 | 0.95 | 2,850.00 | 7.1% |
| Materials total (A) | 23 | 9.29 | 27,870.00 | 69.8% |
Fabric alone is more than half of FOB, and the mesh shell line alone is $5.22. Set its consumption just 0.1 yards too generous and the cost moves by $0.36 a piece, or $1,080 across 3,000 pieces. With a profit of $1,860.00 on this order, a small slip in consumption can wipe out more than half of it.
Amounts are calculated before rounding. The jersey rib costs $0.792 per piece but the screen shows 0.79. The $2,376.00 amount for 3,000 pieces is calculated from $0.792.
The other two blocks are simpler. The CMP of $2.95 comes straight from process analysis. The other costs of $0.45 are ocean freight $0.20, testing $0.08, handling $0.05, commission $0.07 and finance $0.05.
The Quote Gets Cut in Negotiation
A cost sheet is not final on the first try. It gets rewritten several times as prices go back and forth with the buyer. In this example it took three rounds.
The first quote (Offer 1) was calculated on June 2, 2026 with the company’s library prices, the standard unit price registered for each material. At those prices the pre-cost was $14.05, the margin $1.26 and FOB $15.31.
The buyer wanted a lower price, so the vendor went back to its fabric and trim suppliers. Mesh came down from $4.032 to $3.600 a yard, the jersey lining from $2.016 to $1.800, and the zipper from $0.308 to $0.280. As material prices fell, so did the pre-cost. The second quote (Nego 1) came to a pre-cost of $13.24 and FOB of $14.10.

As the chart shows, the margin fell faster than the cost. The pre-cost went from $14.05 to $12.69, but the margin went from $1.26 to $0.62, less than half. Supplier price cuts could not cover all of what the buyer took off the price, and the shortfall came out of the vendor’s margin. The final quote (Final Nego), agreed on June 30, was a pre-cost of $12.69, a margin of $0.62 and FOB of $13.31.
One number here can be confusing. The bidding screen shows the margin as 4.9%, while the cost sheet above shows profit as 4.7%. Both are $0.62 a piece. The bidding screen divides by the $12.69 cost and the cost sheet divides by the $13.31 FOB, so the percentages differ. From here on we follow the cost sheet’s 4.7%.
Profit Keeps Shrinking After the Price Is Fixed
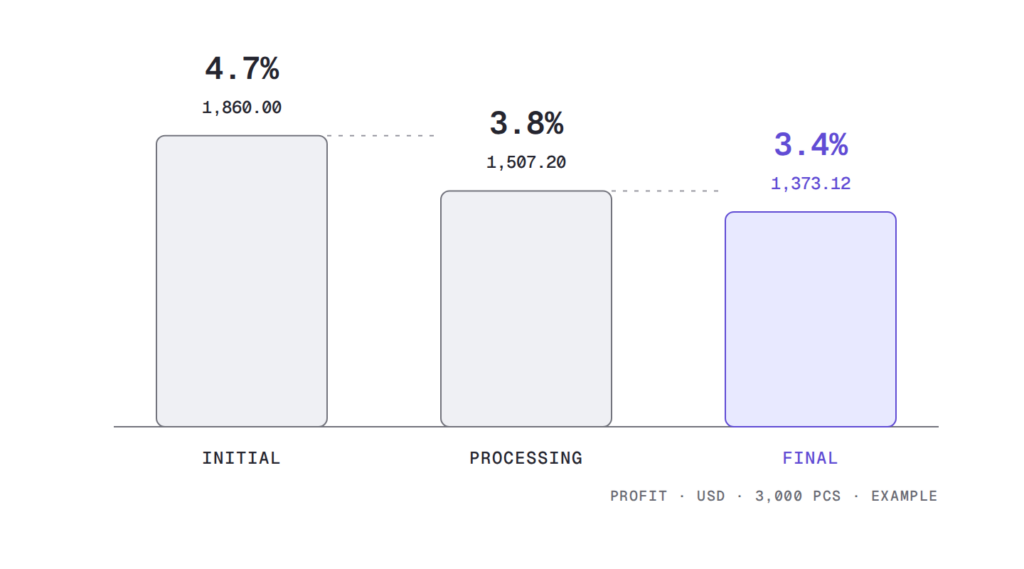
Once the price is fixed, the cost sheet becomes the baseline. Now real money goes out. Fabric is ordered, the factory produces, the goods go on a ship and the buyer receives them. The cost sheet records this in three columns: confirmed cost (Initial), at ordering (Processing) and at shipment and settlement (Final).
| Point | Net cost total (USD) | Profit (USD) | Profit rate |
|---|---|---|---|
| Confirmed cost (Initial) | 38,070.00 | 1,860.00 | 4.7% |
| At ordering (Processing) | 38,422.80 | 1,507.20 | 3.8% |
| Shipment and settlement (Final) | 38,637.60 | 1,373.12 | 3.4% |
At ordering, cost went up by $352.80. Fabric was the biggest piece. Mesh needed 4,350 yards for 3,000 pieces, but 4,402 yards were ordered, 52 yards and $187.20 more. Zippers, labels, thread and elastic were each ordered a little over, adding $60.60 in sewing trims, and packing trims rose by $15.00. In outsourced processes the quantity stayed at 3,000 pieces, but the print amount went from $1,050.00 to $1,140.00, adding $90.00.
By shipment and settlement, a few more things were added. The fabric quantities the suppliers actually shipped changed again, so the material difference grew to $417.60. Ocean freight went from $600.00 to $690.00 and testing from $240.00 to $300.00, adding $150.00 to other costs. On top of that, a buyer claim took away $106.48, and a debit note the vendor issued brought in $187.20.

In the end profit fell from $1,860.00 to $1,373.12, down $486.88. As a rate, 4.7% became 3.4%. No single line was badly wrong. Extra fabric, higher freight and testing, and one claim added up to this difference.
Feed the Settlement Differences Back Into the Next Quote
Once you have the post-cost, the next quote can be less wrong.
This order’s settlement shows clearly what to revisit next time. Mesh used 52 yards more than planned, so the consumption or allowance needs another look. Ocean freight and testing came in higher than quoted, so the baseline for other costs needs fixing. The print charge went up, so its library price needs updating.
Done in Excel, this step is often skipped. When the quote file, the purchase file and the settlement file live apart, just matching the three files line by line after the order closes is a job in itself. Then the next order comes in, the last settlement gets buried, and the new quote starts again from the old library prices.
The Monolis cost sheet puts confirmed cost, at ordering and at settlement side by side on every line. On the mesh line alone you can see the plan of 4,350 yards, the order of 4,402 yards and the $187.20 difference in one place. What to fix for the next quote shows up on the same line.
Wrapping Up
Pre-costing builds three blocks, materials, CMP and other costs, one line at a time. Materials take 69.8% of FOB, so getting consumption and unit prices right is most of the work. The quote gets cut in negotiation, and whatever supplier price cuts can’t cover comes out of the margin. Even after the price is fixed, extra fabric, higher freight and testing, and claims wear the profit down bit by bit.
In this example, a 4.7% profit on the confirmed cost became 3.4% at settlement. Feed the difference between those two numbers back into the next quote and the next order’s pre-cost gets a little more accurate.
Glossary
- Pre-cost: the cost calculated from planned quantities and prices before the price is set.
- Post-cost: the cost recalculated after the order from what was actually ordered and paid.
- CBD (cost breakdown): the cost sheet that splits cost into line items.
- Consumption (YY): the amount of a material one garment uses, in yards for fabric and pieces for trims.
- FOB: the price including all costs up to loading on the ship at the export port. It is what the buyer pays the vendor.
- CMP: cut, make and pack, the factory’s processing charge.
- Claim note: a document from the buyer deducting an amount for a quality or delivery problem.
- Debit note: a document sent to another party to charge them a cost.
👉 Why CM Is the Only Shared Variable in FOB Cost
👉 Why Vendor and Factory Calculate the Same CM in Opposite Directions
👉 Process Analysis Is Cost Design: Six Steps Where AI Builds the CM
References
- SIJE, Monolis demo screens “Bidding” (BID-2026-0142) and “Cost Breakdown” (DR-2026-001). Example data built on a fictional style and buyer, not actual customer figures. Covers pre-cost, margin and FOB for the three quoting rounds, library and negotiated unit prices, consumption, unit price and amount for 23 material lines, amounts and differences at confirmed cost, ordering and settlement, claim note CN-260918001 and debit note DN-260905001. ↩
