We explored in the previous post why it’s important to detect human movements in the sewing production site.
In this post, I’ll explain the journey of how the actual measured data gets uploaded to the server and is displayed on the Korean headquarters’ webpage.
Smart Pre-Processing Inside the Factory: The Role of the Local Server
What if we sent raw data from hundreds of Monolog devices directly to Korea?
- The volume would be massive.
- Internet costs would skyrocket.
- Real-time responsiveness would suffer.
So, we placed an on-site local server in the factory.
This server acts as an intermediary—receiving, filtering, and summarizing the data before transmission.
Examples:
- “If the vibration is within normal range, no need to send it all—just summarize.”
- “If there’s an error or anomaly, highlight and send it.”
The local (edge) server works like a news editor—
selecting only the important parts of hundreds of ‘articles’ and sending a concise, useful summary.
Thanks to this system:
- Only core data reaches the cloud
- Network costs are minimized
- The whole system runs lighter and faster
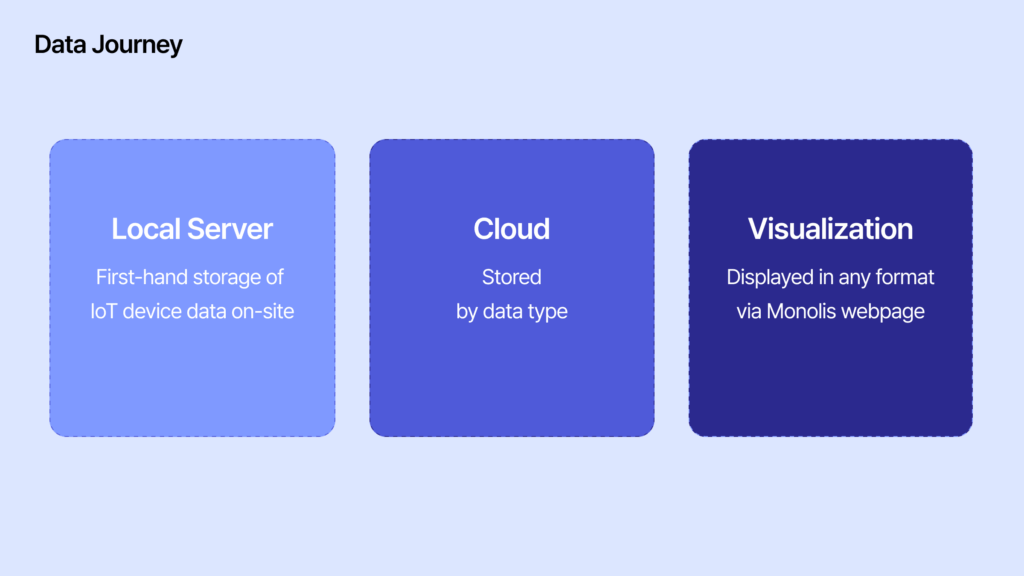
A Data Journey Across Borders – From Factory to Cloud
In the previous part, we explained how data is collected from a Vietnamese garment factory.
Now, the refined data from the edge server is transmitted to the cloud server at the headquarters in Korea.
But “transmitted” doesn’t mean the job is done.
What about security?
Since the factory and headquarters are connected via the internet, secure communication is essential.
- We used encrypted protocols like HTTPS by default.
- We implemented MQTT for lightweight and fast data transmission.
- And in case of disconnection, a message queue system ensured that no data was lost.
So what does the “luggage” of traveling data look like?
Typically, it took the form of JSON packets like this:

Hundreds of these data packets were transmitted every second and stored in real time on the cloud.
Organized Processing in the Cloud
Once the data arrived at the cloud, it was processed step by step:
- Real-time data → Stored in-memory using tools like Redis, to quickly reflect the current state
- Daily/monthly summaries → Stored in PostgreSQL or MySQL databases, for trend analysis and reporting
- Long-term backups → Saved in object storage like Amazon S3, in case of future audits or troubleshooting
In addition, if any anomalies were detected, the system would immediately notify:
- via Slack
- via email alerts
- or through web notifications
The Moment Data Becomes Visible – Real-Time Visualization
Finally, users at the Korean headquarters accessed the company’s web dashboard.
Here, front-end frameworks like React or Vue communicated with the API server to fetch the data.
Here’s how a typical request worked:

The backend queried the database and returned JSON data,
which the browser then transformed into tables, charts, and alert messages.
On the web interface, the data appeared like this:

- Current production output for a specific line or process
- Progress against target output
- Actual sewing time vs. handling time
From this, HQ managers could quickly conclude:
- “There’s a bottleneck in this line—we need to improve that process.”
- “Handling time is increasing for this task; maybe the method needs updating.”
- “This line performs better on this product style—let’s allocate more of that in the future.”
In Summary – All This Happens in Just a Few Seconds
To summarize:
- A single vibration from a sewing machine
- Is detected by Monolog,
- Processed by the edge server,
- Transmitted via the cloud,
- And visualized on the headquarters web dashboard—
All in as little as 1 to 3 seconds.
That data you check with a single browser click?
Behind it are hundreds of devices, dozens of technologies,
and invisible teamwork running in real time.
So next time you look at a factory data dashboard,
Remember the complex and beautiful journey behind the screen.