What’s Visible and What’s Not
“Viewing factory data in real time on the web.”
It sounds simple.
But behind that simple phrase lies a silent, complex system of devices, software, and technologies all working together.
This article will walk you through how the data you see on that dashboard is collected, where it comes from, how it’s processed, and why each step matters—in the simplest way possible.
Monolog Detects the Human Touch – A Window into Focus
In a factory, the most important element isn’t the machine.
It’s the person operating it—the worker.
Just because a sewing machine is running doesn’t mean the garments are being properly made.
What truly matters is whether the worker is focused, with their hands consistently on the machine.
So, simply knowing “the machine is running” wasn’t enough.
That’s why we created Monolog.
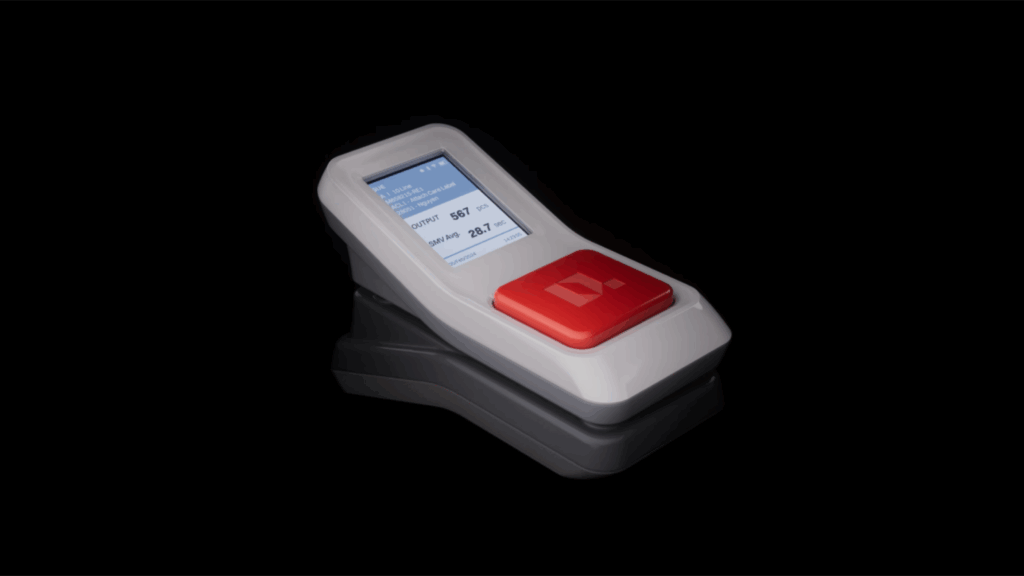
This compact IoT device doesn’t monitor the sewing machine itself, but the presence and pressure of the human hand resting on it.
How does it work?
It analyzes vibration and pressure patterns.
- When a hand is placed steadily, the vibrations follow a consistent rhythm.
- When the hand lifts or hesitates, the vibrations drop or become irregular.
- If sewing stops, Monolog can detect whether the halt was intentional or a mistake.
So, Monolog doesn’t just monitor a machine.
It captures how focused the operator is while using the machine.
Visualizing the Worker’s Efficiency Curve
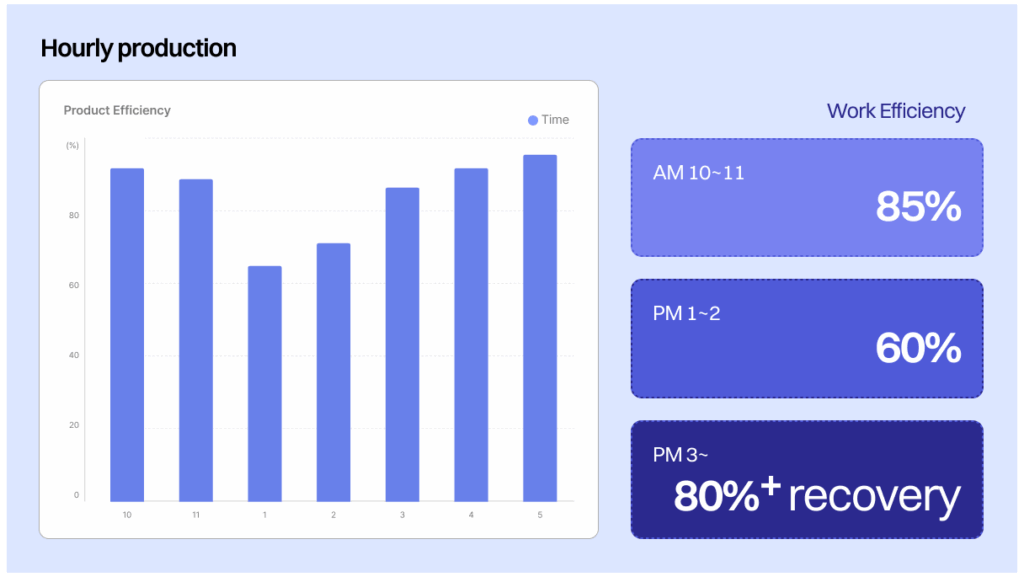
Based on this data, we can now visualize things like:
- 10:00–11:00 AM: 85% work efficiency
- 1:00–2:00 PM: 60% efficiency after lunch
- After 3:00 PM: back up to 80% or more
From this, you can analyze patterns like:
“This worker’s concentration dips after lunch.”
“This team works faster in the morning.”
In the past, these observations came from hand-written daily logs or a manager’s gut feeling.
Now, sensor-generated data gives a more objective and consistent view.
Beyond Simple Output Metrics
Previously, factory performance was measured by one key metric:
“How many pieces did this worker sew per hour?”
But that number could be misleading due to:
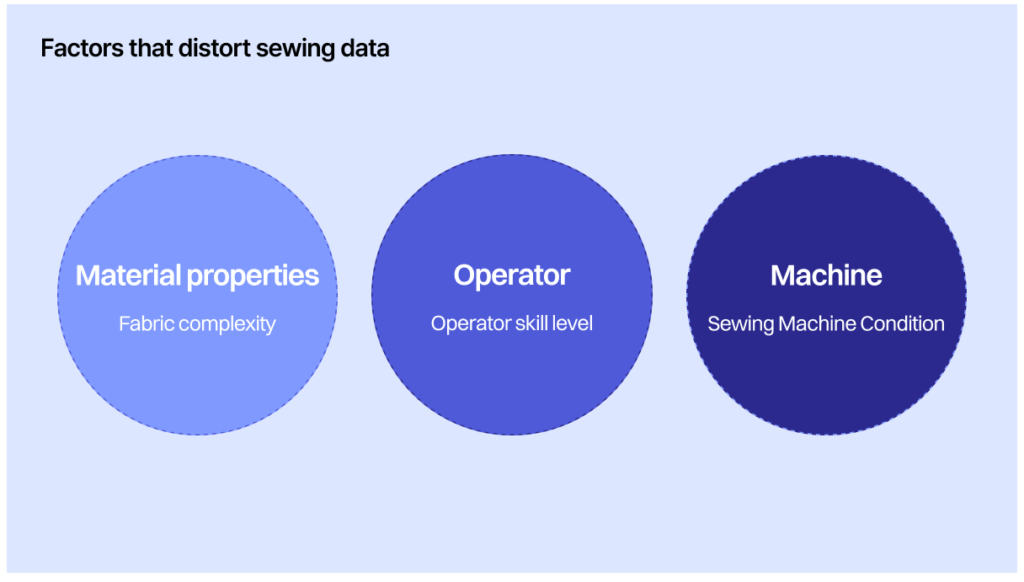
- Fabric complexity
- Disruptions from coworkers
- Machine condition
Monolog’s data, however, tells you how long the worker actually operated the machine —that is, their Net Work Time.
With this, we can calculate true efficiency = output divided by focused work time.
It’s a much fairer and clearer benchmark—for both managers and workers.
A Shift in Perception Through Data
The greatest achievement is that users’ perceptions are changing.
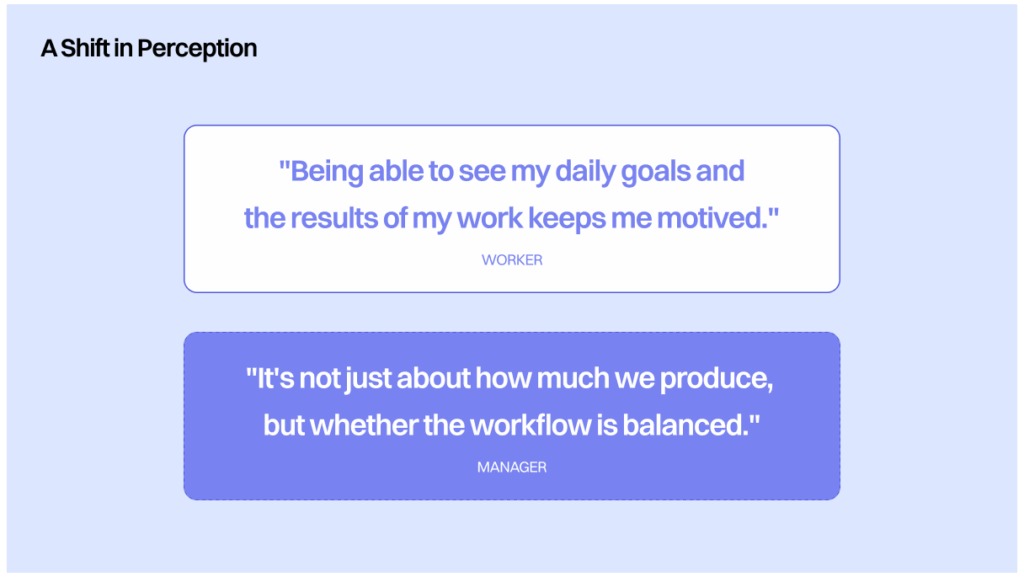
Now, anyone can understand the current situation and see what needs to be improved.
They can motivate themselves on their own.
In this way, Monolog is a small device that turns human touch into data,
and it has become the foundation of data that underpins many decisions.
🔽 Next Post
👉 How Factory Data Moves to Korea’s Dashboard – Part 2
In the next post, I’ll explain how the data collected from the factory is uploaded to the server and how it can be displayed on web pages at the Korean headquarters (or in other countries).
Stay tuned for the next post!